BeeGraphy Editor
The workspace where parametric 2D and 3D models are built from nodes. This page covers the layout, the main menu, adding nodes, canvas controls, collaboration tools, and viewing modes.
01 / Layout
Editor layout
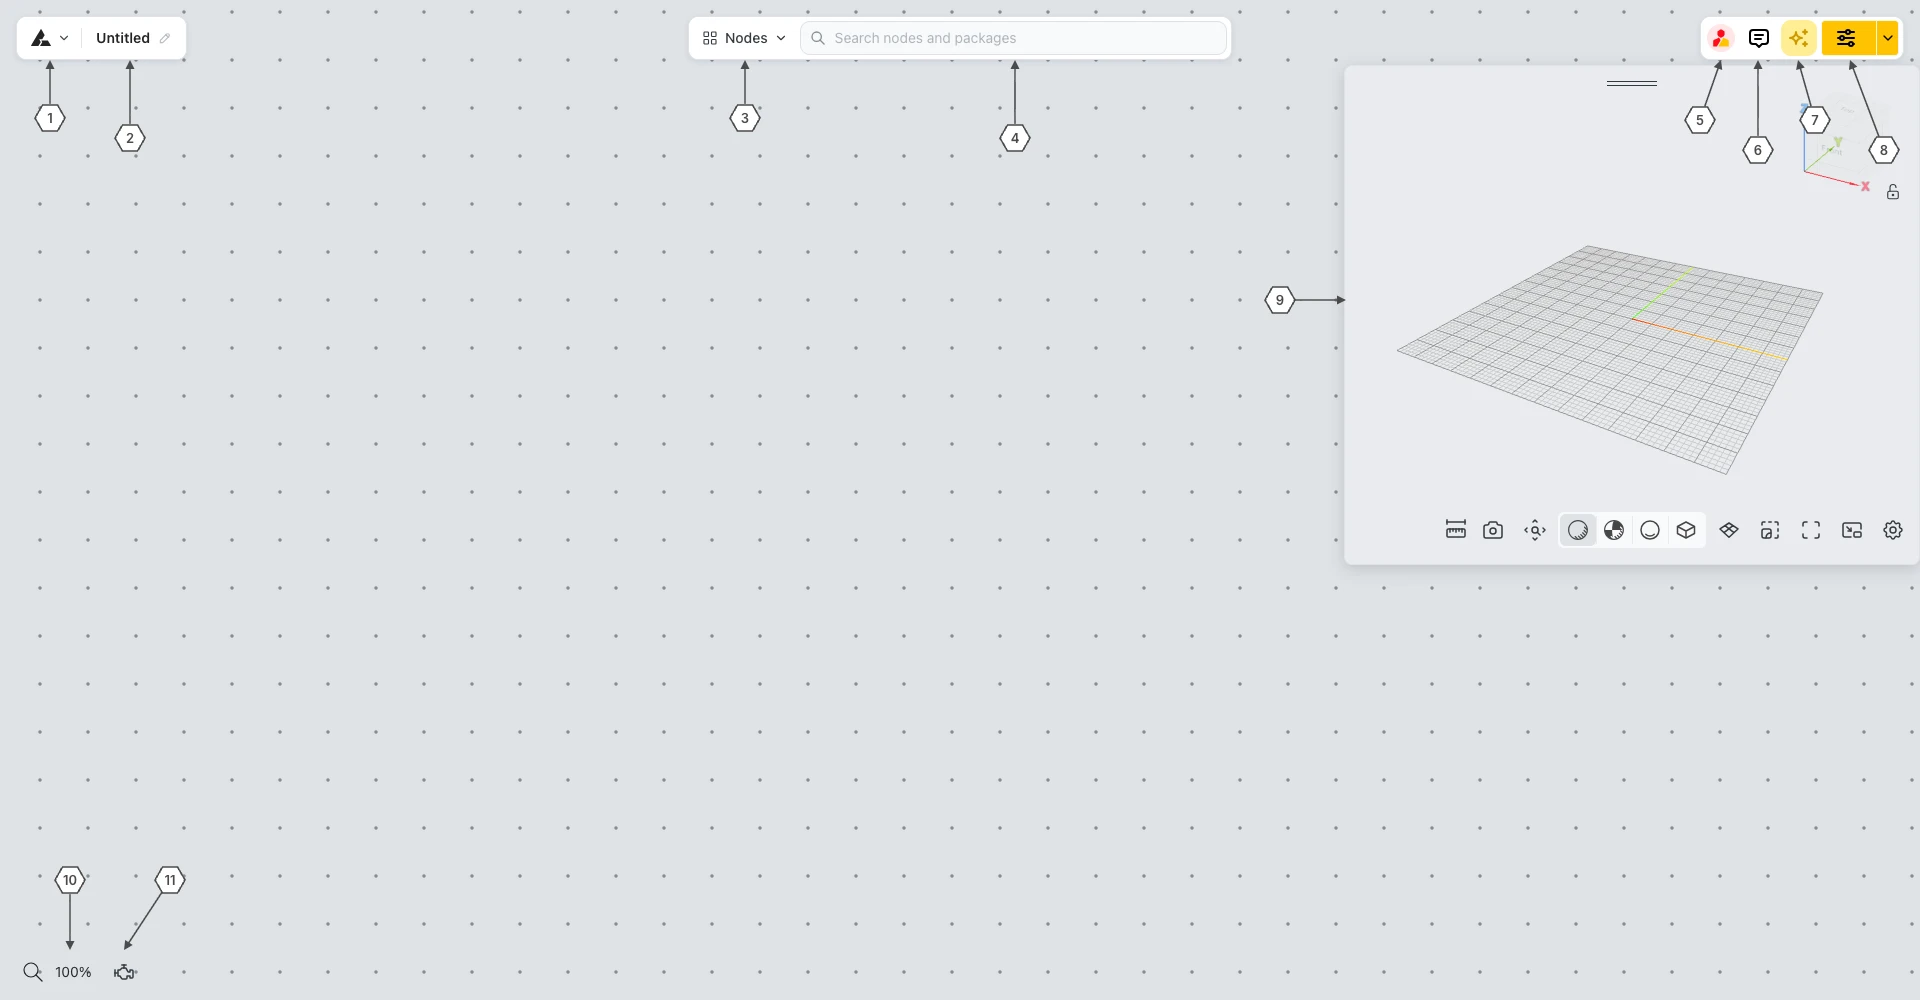
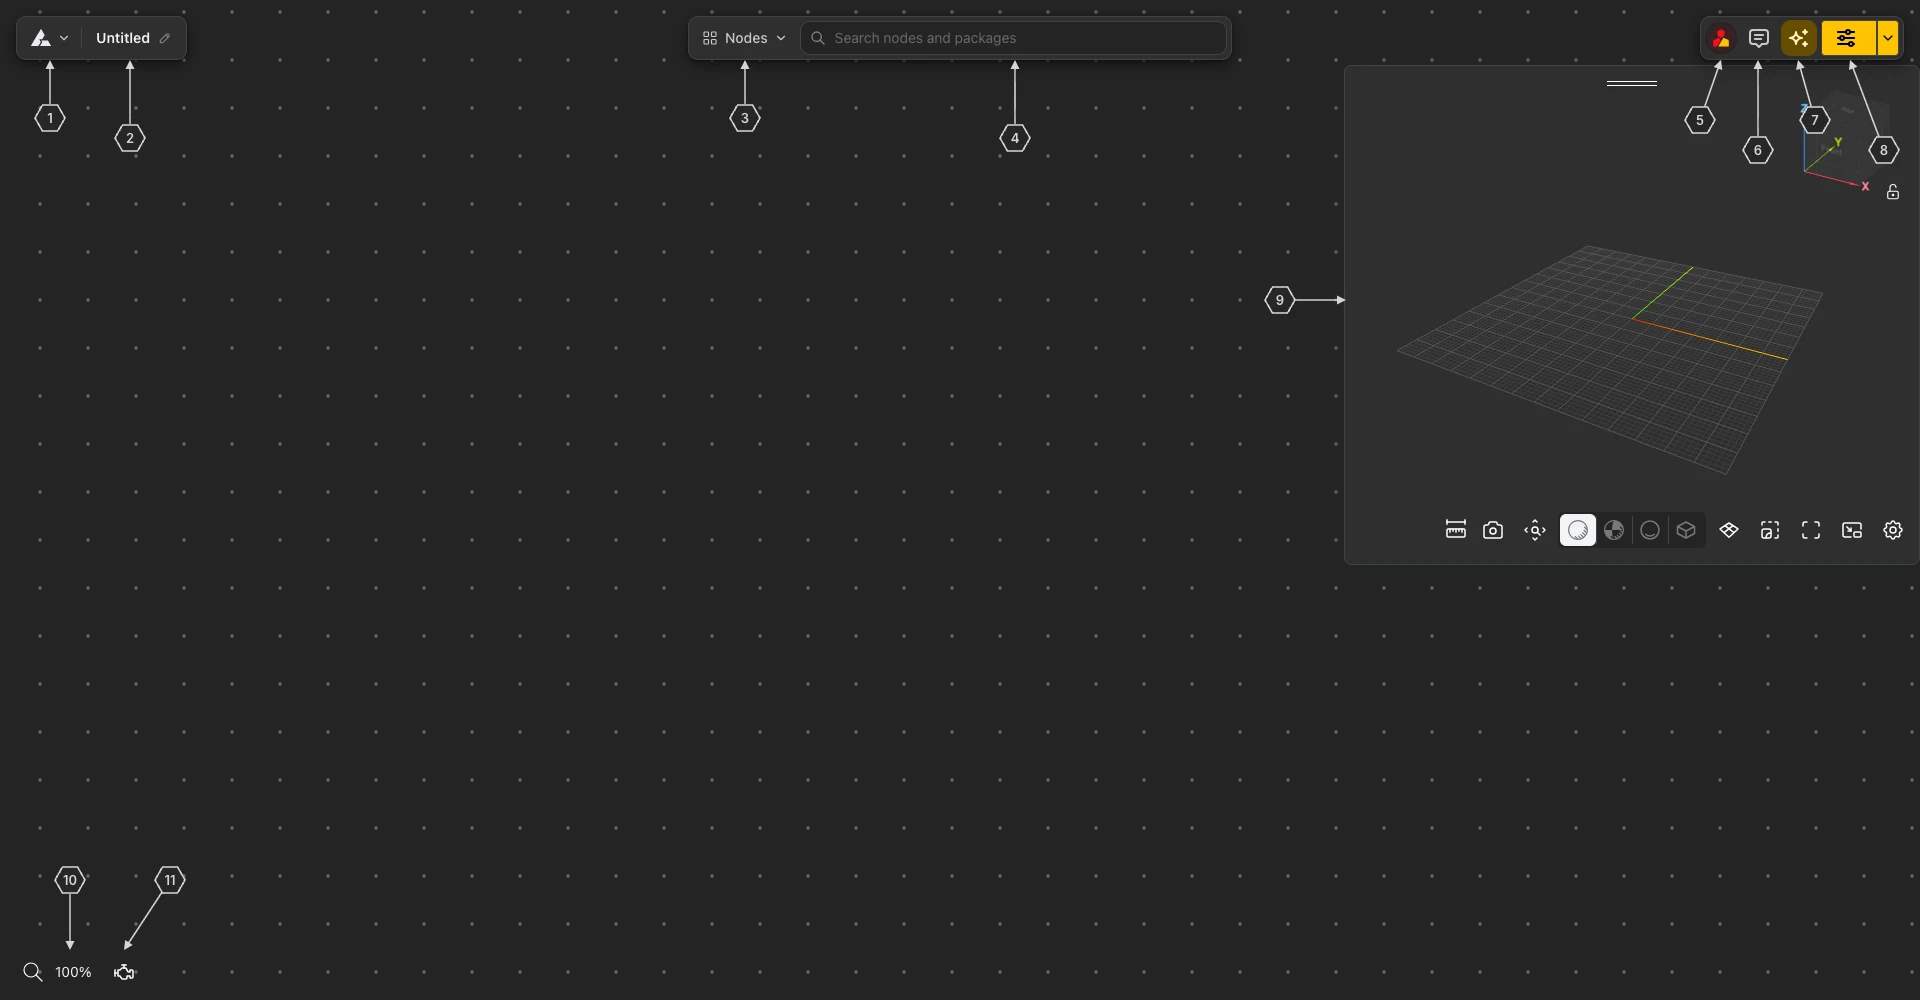
The Editor is a node canvas with a few floating controls around it. The parametric graph is assembled in the middle of the screen by adding nodes and wiring them together. The numbers below match the numbers on the screenshot.
The Editor
- 1Main menu: the BeeGraphy logo with a chevron. Click the chevron to open the main menu; click the logo area to go back to the workspace.
- 2Model name: the name of the model, with a pencil icon to rename it.
- 3Nodes: opens the Nodes panel, where every node is listed by package.
- 4Search field: "Search nodes and packages" finds a node by name.
- 5Active users: shows who is in the model.
- 6Comments: adds and reviews comments on the canvas.
- 7BeeGraphy AI: opens the AI Agent.
- 8Configurator / Demo: the yellow split button that opens the model in an end-user view.
- 93D viewer: the floating panel with the live result of the graph. See 3D View.
- 10Zoom control: the magnifier and zoom percentage at the bottom-left.
- 11Solver: the engine button next to the zoom control.
02 / Main menu
Main menu
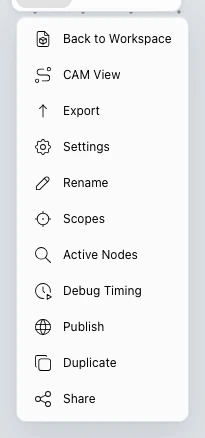
Click the chevron next to the logo 1 to open the main menu. It gathers the actions that apply to the whole model.
Main menu
- Back to Workspace: leaves the Editor and returns to your workspace.
- CAM View: replaces the Editor with the CAM Viewer. See CAM View.
- Export: opens the Export dialog - details below.
- Settings: opens the Settings modal. See Settings.
- Rename: edits the model name in place - details below.
- Scopes: opens the Settings modal directly on its Scopes tab, where you choose which nodes run for preview, export, and CAM. See Scopes.
- Active Nodes: opens a searchable list of the nodes in the graph in its own window - details below.
- Debug Timing: opens a live table of how long each node takes, in its own window - details below.
- Publish, Duplicate, and Share: the same model actions as in the model card menu - details below.
Rename
Choose Rename and the model name at the top-left of the Editor becomes an editable field. Type the new name and press Enter to save it. A name that another model in the organization already uses is rejected, so pick a unique one.
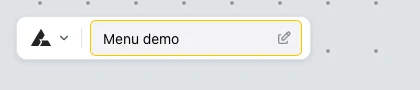
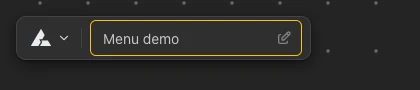
The model name while renaming
Export
Export opens a dialog with the Export Option, the Quality (Polygon density), the Downloading Options (linear and angular deflection), and a Download button. When the graph has no export nodes, the dialog says "No export nodes detected" and the options stay disabled.
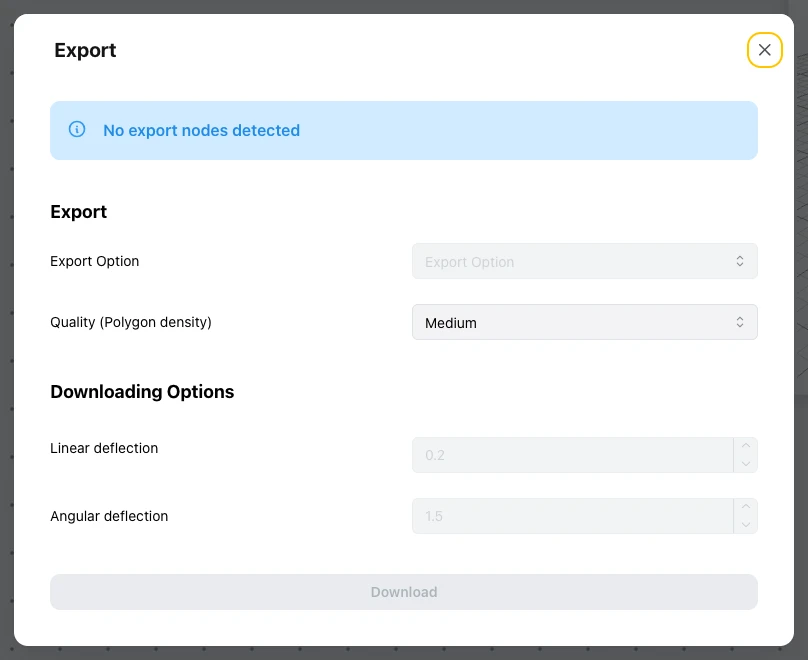
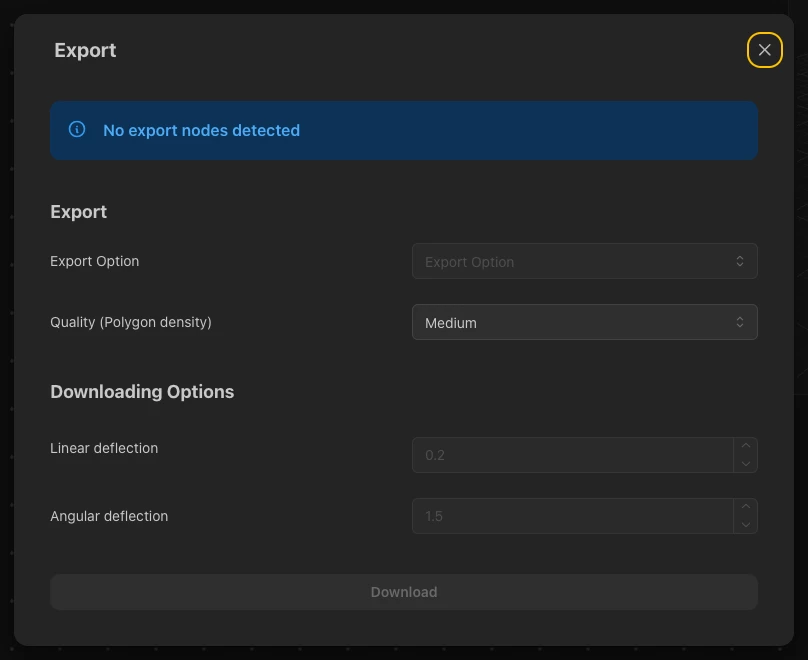
The Export dialog
Active Nodes
Active Nodes opens a separate window, so you can keep it next to the Editor. It lists every node in the graph with its icon, name, and type, and shows the number of nodes in a badge at the top-right. Type in the search field to filter the list by name or type.
Click a node in the list to select it. The Editor centers the node on the canvas, outlines it in yellow, and outlines its geometry in the 3D viewer, which makes it easy to find one node in a large graph.
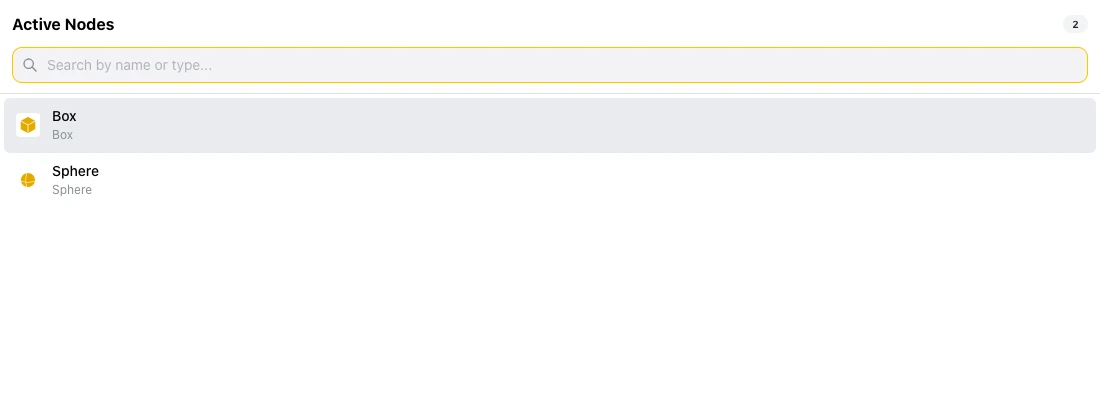
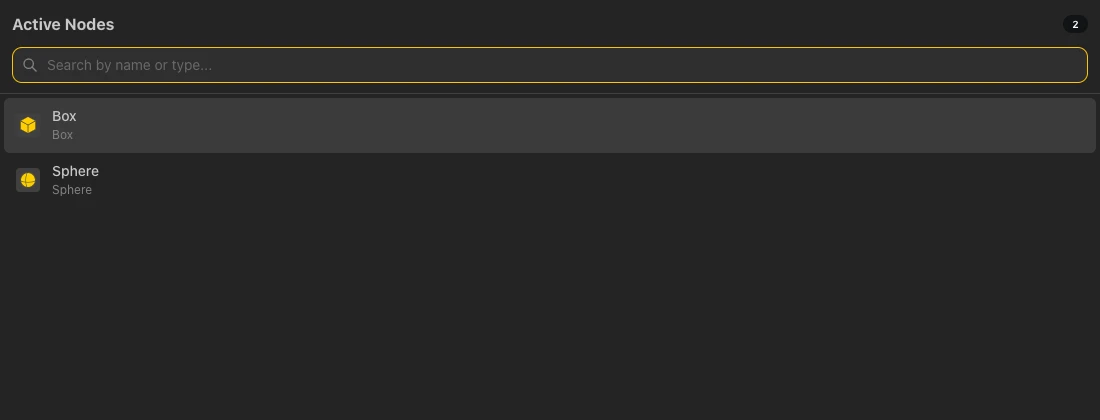
The Active Nodes window
Debug Timing
Debug Timing opens a separate window with a live table of how much time each node takes. A LIVE badge at the top shows that it updates as you work. Use the search field to filter by name, type, or group, and the status menu (All statuses, Idle, Executing, Rendering, Error) to show only nodes in one state.
- Columns: Node, Type, Group, #Exec and #Render (how many times the node ran and rendered), Execution and Rendering time with their share of the total, and Total delay. A pin button sits at the start of each row, and the column headers sort the table.
- Footer: Total calculation time adds up the counts and times of all nodes.
- Toolbar: Reset all timing data, Export CSV, Run All, and Pause live updates. Two more buttons, labelled "Select a node first", are available once you select a node.
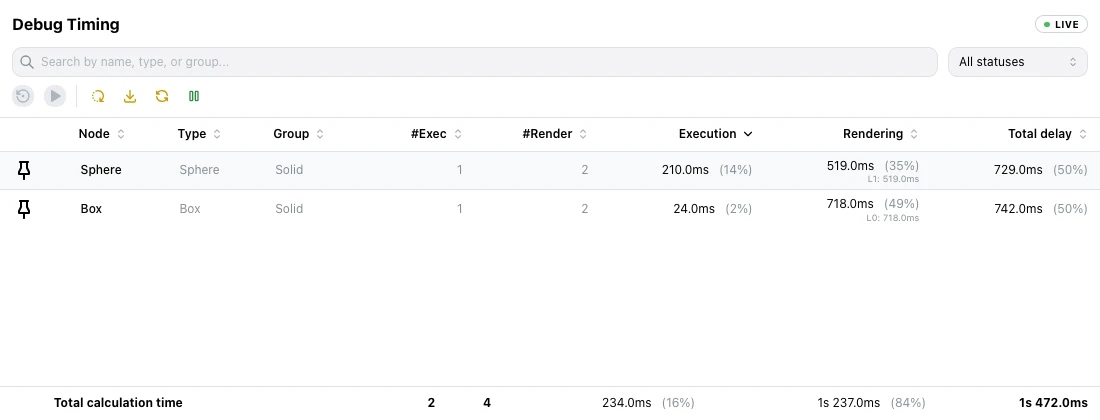
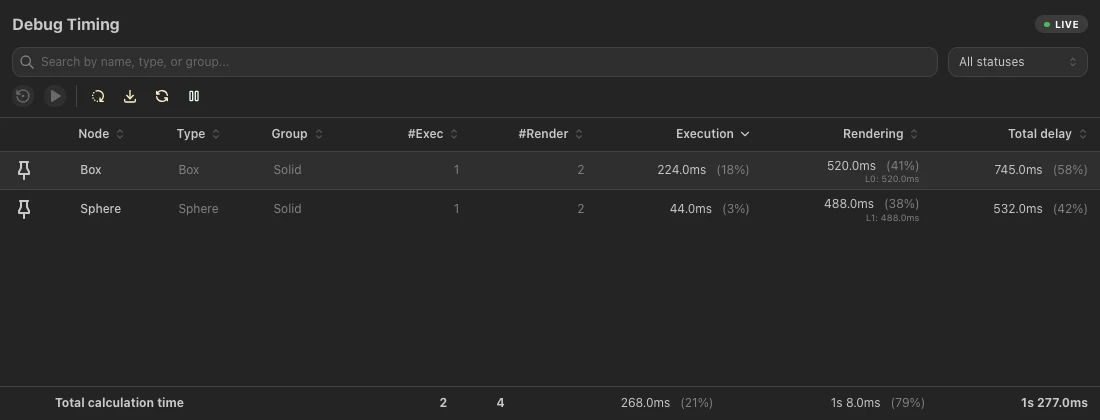
The Debug Timing window
The Show node execution time option in Settings is a related setting, under General.
Publish, Duplicate, and Share
- Publish: opens the publish page for the model, described in Model.
- Duplicate: opens the Duplicate Model dialog. Choose the workspace to duplicate the model into, enter a Name, and click Duplicate.
- Share: opens the Share dialog for the model, with the user invitations, the Everyone URL permission, the Subcontractors toggle, Copy link, and Embed. See Model.
03 / Nodes
Adding nodes
Three ways to put a node on the canvas: browse the Nodes panel, search by name, or double-click the canvas to open the Node Chooser.
Nodes panel
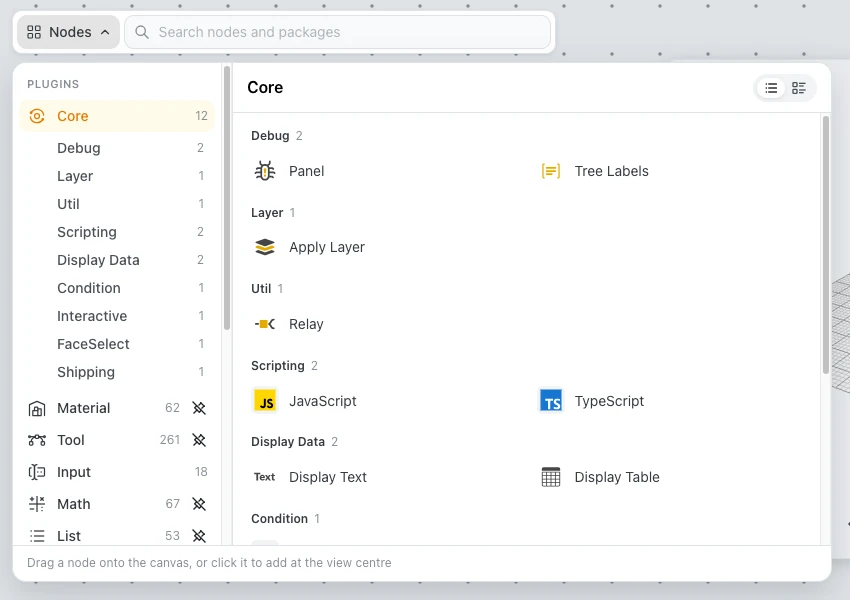
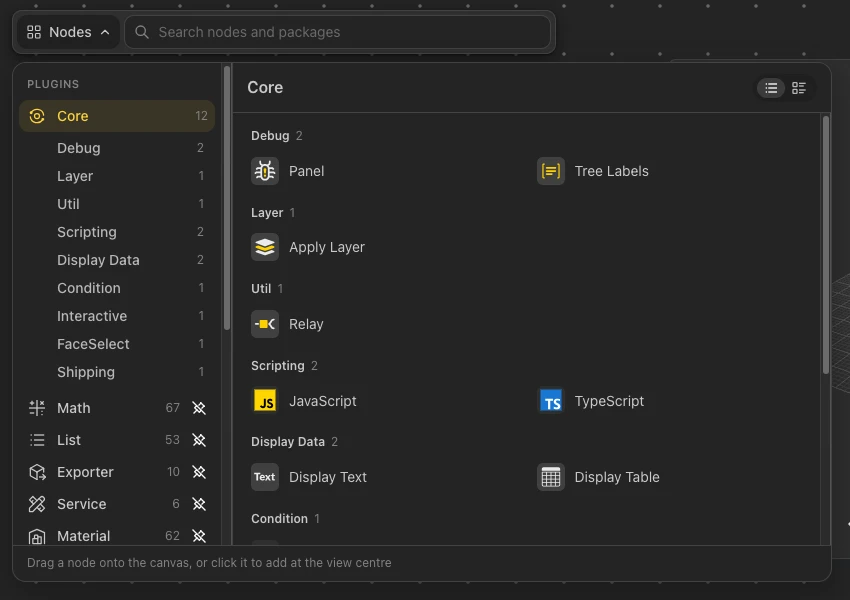
Click Nodes 3 to open the panel. The left column lists the plugins, each with the number of nodes it holds. Core comes first and is organized in groups such as Debug, Layer, Util, Scripting, Display Data, Condition, Interactive, FaceSelect, and Shipping. Packages such as Math, List, Material, Exporter, Tool, and Machine follow. Pick a plugin to see its nodes on the right, grouped by purpose.
The Nodes panel
- Add a node: drag it onto the canvas, or click it to add it at the centre of the view.
- View buttons: two buttons switch the node list between a list and a detailed list.
- Pin a package: every plugin except Core has a pin button that pins the package to the top menu.
Search
Type in the search field 4 to search nodes and packages. The panel shows the matches as Search results, grouped by category.
Node Chooser
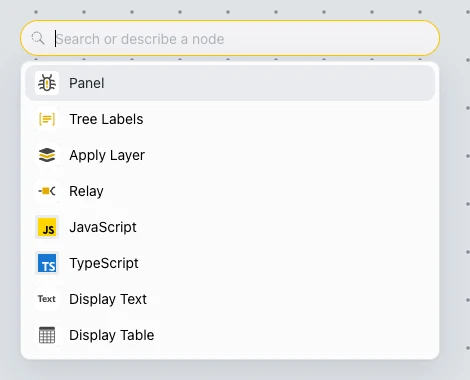
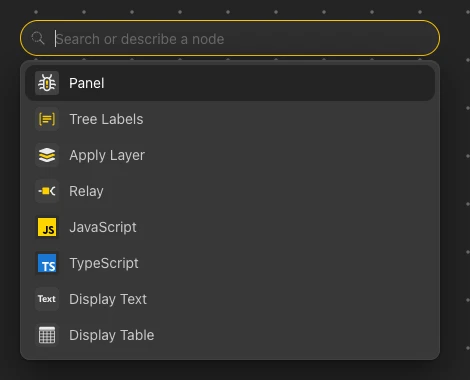
Double-click an empty spot on the canvas to open the Node Chooser. Type a name or describe the node you want in the Search or describe a node box, or pick one of the suggestions shown below it.
Double-click the canvas to open
04 / Canvas
Canvas controls
Move around the workspace, zoom in and out, and pause the solver when you need to reshape a complex graph.
Panning the workspace
Hold the right mouse button and drag to pan in any direction. Panning only changes the view - it never moves the nodes themselves.
Zoom
Use the mouse scroll wheel to zoom in and out, or click the zoom control 10 in the lower-left corner to open its menu. Zoom to Fit reframes the view so every node is visible.
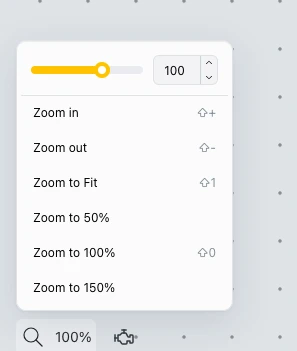
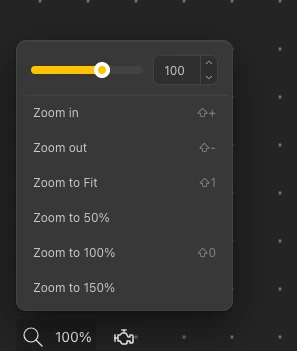
Zoom menu
The menu offers these entries, and the shortcuts below work from the keyboard:
- Zoom in, Zoom out, and Zoom to Fit.
- Zoom to 50%, Zoom to 100%, and Zoom to 150%.
Shortcut
Action
Zoom to 100%
Zoom to Fit - shows all nodes at once
Zoom in
Zoom out
To zoom the graph to a node automatically when you pick its geometry in the viewer, turn on Auto zoom in Settings, under General. See Settings.
Solver
The solver button 11 pauses all graph calculations. Use it when you need to make several parameter changes in sequence without waiting for intermediate recomputes. Its tooltip switches between Stop Solver and Resume Solver - press it again to resume.
05 / 3D viewer
3D viewer
The live result of the graph is shown in a floating panel 9 on top of the canvas. Its toolbar holds the measuring tool, camera positions, display modes, the thumbnail generator, and the Settings button. Every control is described on the 3D View page.
06 / User Zone
User zone
The controls in the upper-right corner are for collaboration and for opening the model in other views.
- 5Active users: shows who is in the model.
- 6Comments: offers an Add comment action.
- 7BeeGraphy AI: opens the AI Agent panel, where you can build and edit graphs by chatting.
- 8Configurator / Demo: the split button that opens the model in an end-user view.
Active users
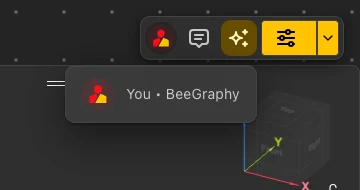
Click the active users button 5 to see who is in the model. Your own entry is marked as You.
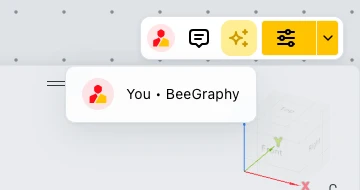
Active users
07 / Comments
Comments
Pin threaded comments anywhere on the canvas for review and collaboration.
Step 1. Click the Comments button 6 and choose Add comment - the cursor changes to a comment pin.
Step 2. Click the spot on the workspace where you want the comment anchored.
Step 3. Type your message in the field that appears, then press the send button.
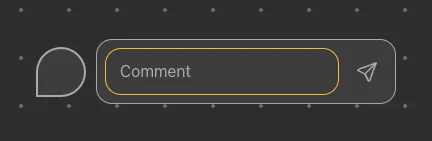
Placing a comment

Writing the comment

Pinned on the canvas
08 / Viewing
Viewing modes
The yellow split button 8 opens your model in one of two end-user views - Configurator or Demo. Click its arrow to choose.
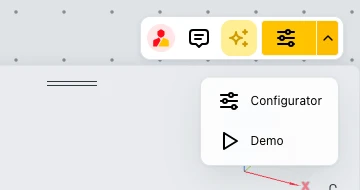
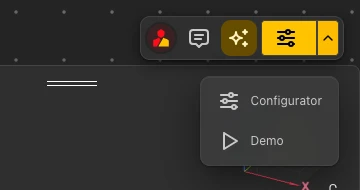
Choose a mode

Configurator
Select and configure parameters as an end user would. Changes made here are reflected back in the Editor. You can rename variables, reorder them, tweak values, and set the camera position and direction on the model.

Demo
Adjust parameters and orbit the model from any angle. Intended for quick review and presentation, without the full configurator surface.
Once you pick a mode, the button remembers it - from then on, a single click on the main part of the button opens the model in the last-used mode directly.